
Cradle DASH Module
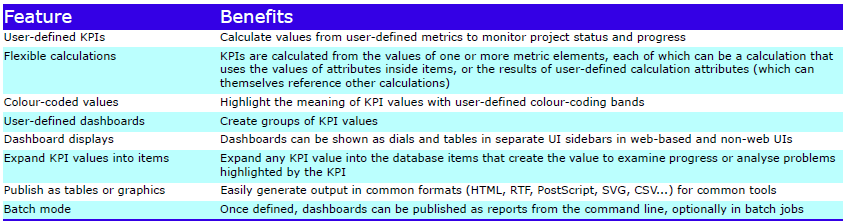
The Cradle DASH module provides the means to define Key Performance Indicators (KPIs) . It also provides the means to define their presentation as dashboards in web UIs, non-web UIs and reports.
Every project uses a process to create, review and publish its objectives, operational concept, sets of requirements, architecture and design models, and other systems engineering data. These processes will include:
- Management reporting
- Quality checks
- Routine audits
of the volume of work completed, and the completeness and quality of this work.
Key Performance Indicators (KPIs)
KPIs are measures of the maturity of the information managed in the process, and therefore of the process itself.
Cradle supports KPIs as a convenient means to provide an overview of the status of an entire project, or any phase.
Any number of KPIs can be defined. Each KPI is a calculation based on one or more elements of one or more metrics:
- Product
- Sum
- Difference
- Deduction
- Proportion
- Percentage
combined to produce a single numerical value. The component values are derived from user-defined queries, that are searches of database items, or searches of the links between these items, or both. The component metrics can:
- Count the values or calculate the total, mean, average, range or variance of the values from the items found by the queries
- Use values held in attributes or the results from user-defined calculation attributes
- These calculation attributes can use other attributes of the same item (this includes other calculations) and also attributes from linked items, such as calculating the total cost from the individual costs of a parent and its children.
Any number of colour-coded range bands can be defined for each KPI so that its value can be shown in a block with an appropriate background colour.
Using colours for the KPIs allows the overall project status to be seen at a glance. Typically, anything shown in green is good, anything shown in red will need urgent attention, and anything yellow needs to be monitored carefully. It is easy to apply such traffic light conventions in a KPI’s colour bands.
Dashboards
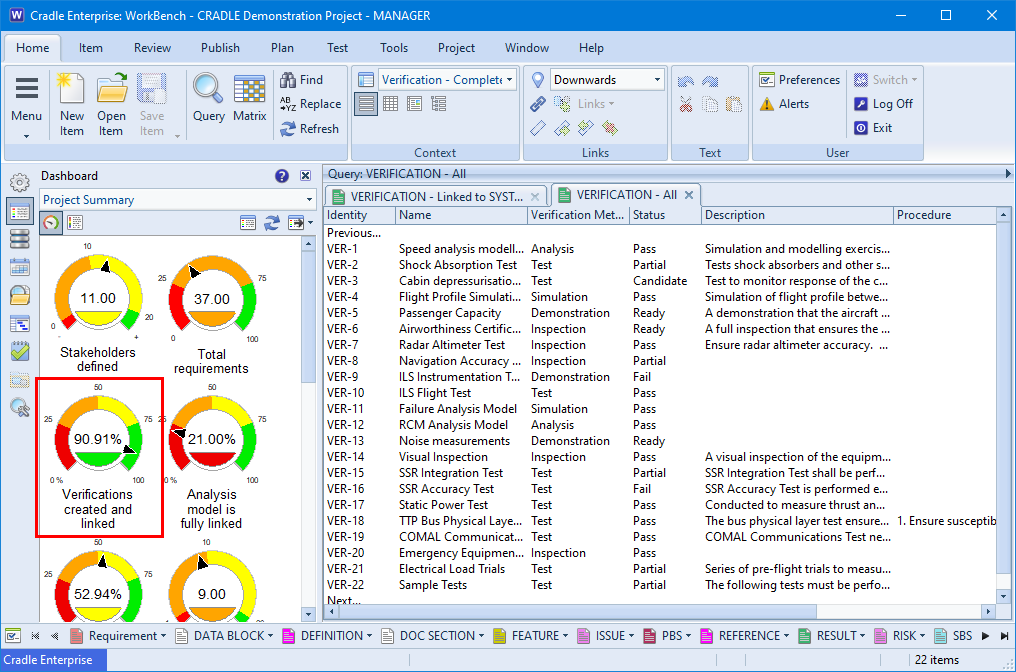
A collection of KPIs is held in a dashboard. Any number of dashboards can be defined, either personal to you, shared with other members of your team, or shared with everyone in the project, or available to all projects.
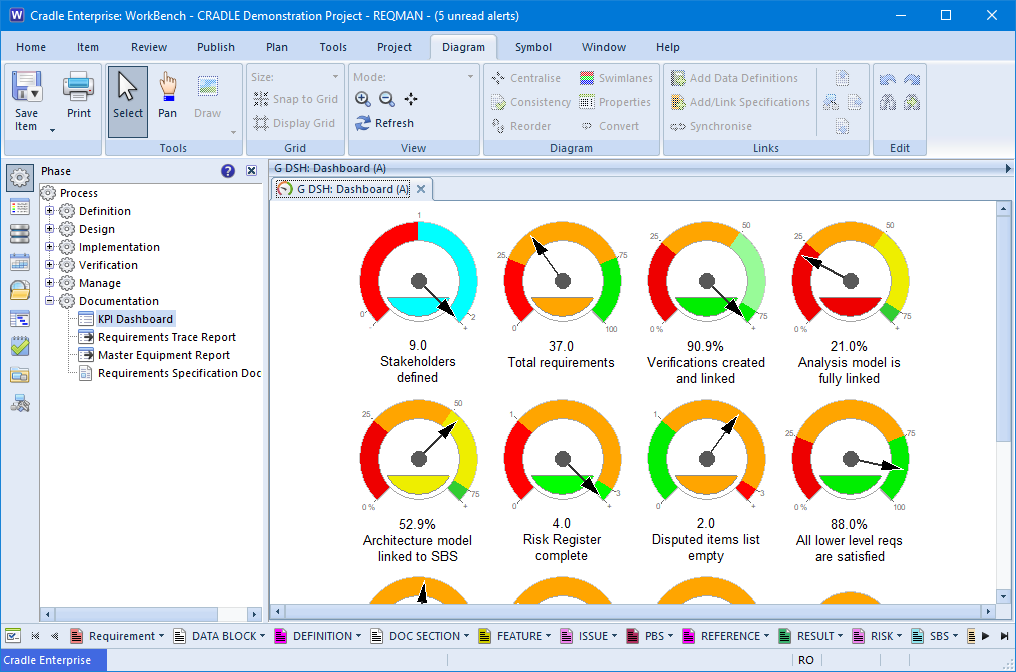
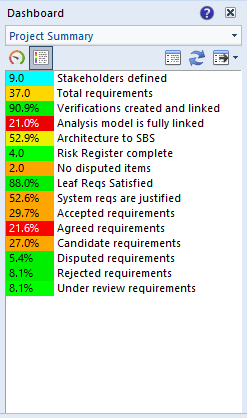
Each dashboard presents its KPIs as a column with the KPI shown either as a name and colour-coded number:
or as a dial:
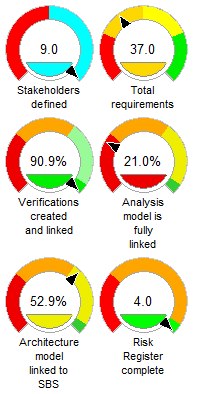
The size and display styles of the dials can be controlled for each KPI.
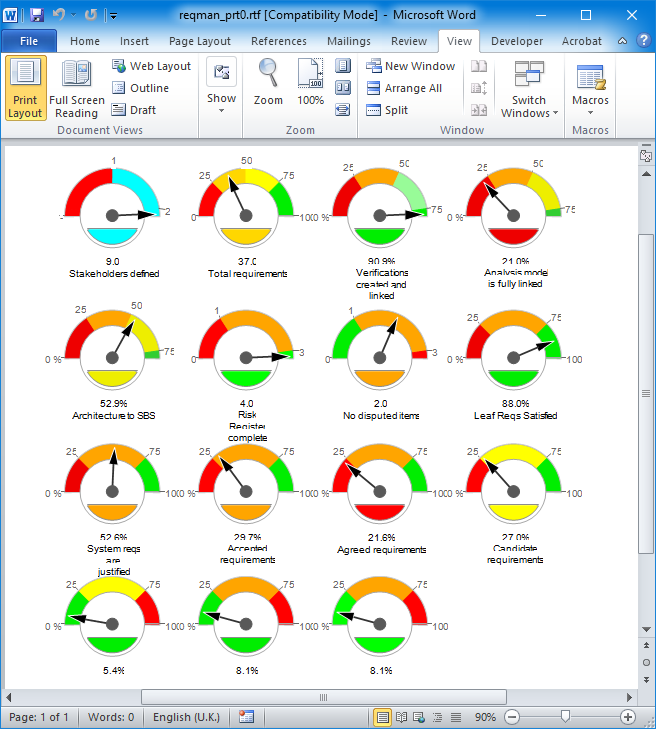
The dashboard can be published as a report, either as a table or as a set of dials. As for all reports, output can be to a file, a printer or the UI. Such dashboard reports are fully supported in web UIs, and non-web UIs.
The value shown in each KPI is a link. Selecting this value will display the list of items that have been used to create the KPI’s value.
Dashboards are shown in a separate sidebar in both web UIs and non-web UIs. One dashboard can be set as the default and can be shown automatically when the UI starts.
Custom web UIs could be created to show a collection of dashboards, for example to provide a simple overview of the project and more detailed analyses of the status of each work area.
Dashboards can be published to RTF, HTML and CSV files.
Feature Summary
Please contact 3SL for further information about adding a Cradle DASH licence to your existing system.