Cradle Modules – PDM

The Cradle PDM module provides the infrastructure for all other Cradle modules. Its scalability and flexibility create an industrial strength, proven, shared data environment for even the largest projects:

Cradle PDM Module
Cradle PDM Module

Databases

Cradle supports any number of databases, each with its own schema, CM system and users. Each database supports many projects. Use the Project Manager tool to organise this environment by user-defined criteria, for example as hierarchies.

Each database stores any number of items, of any number of types (requirements, risks, classes, user stories, functions) defined by a UI. Items have any number of attributes, each of a user-defined type, that manage up to 1 TByte of any type of data, held in Cradle, or referenced in external files, URLs or another tool or environment.

Calculations

User-defined calculations are supported in all parts of Cradle and can be displayed as graphs, in views and user-defined reports. User-defined rules can be applied to automatically set attribute values or perform calculations, to maintain the integrity within and between items.

Cross References

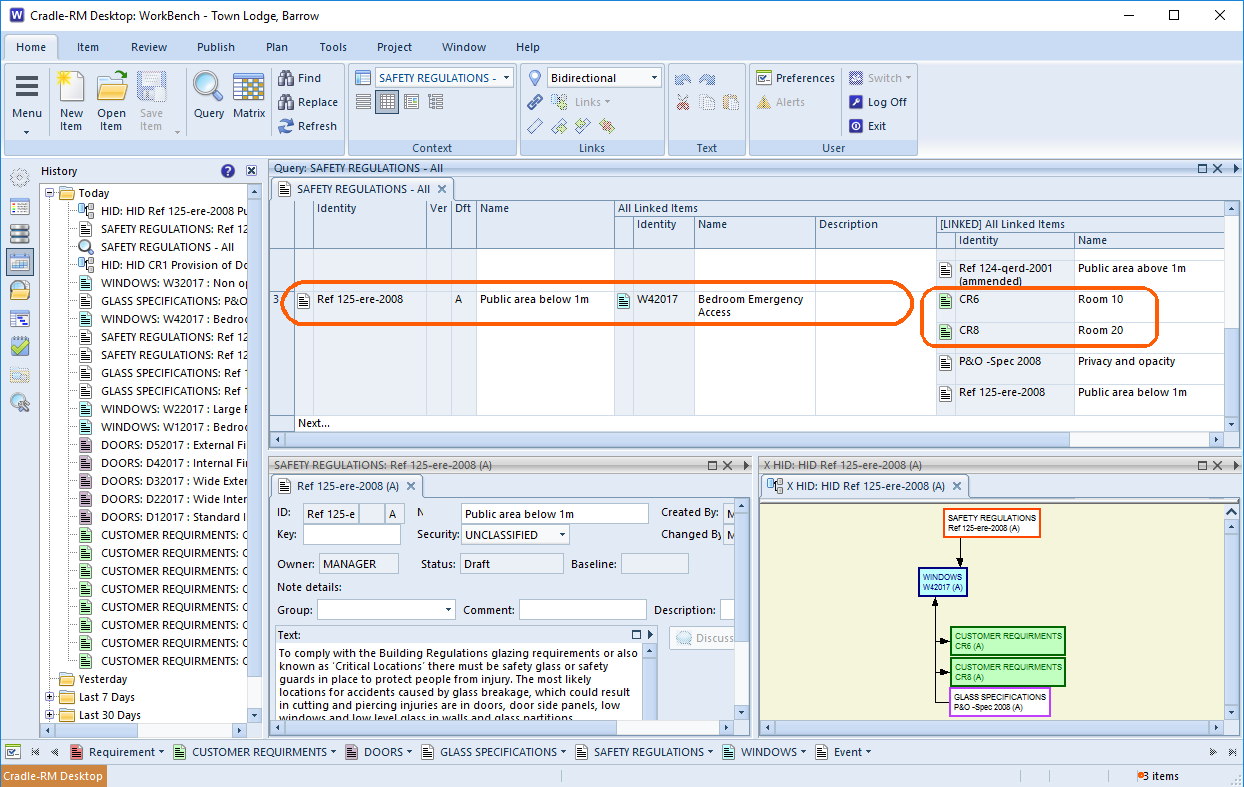
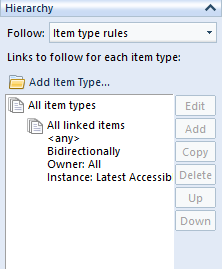
Items can be cross referenced, with optional user-defined link types and groups. Links have user-defined attributes to justify, parametrise, explain or characterise them. You control which links are used to navigate or report traceability, based on link type or group, direction and link attribute values. Links are both direct and indirect, for full lifecycle traceability, impact and coverage analyses.

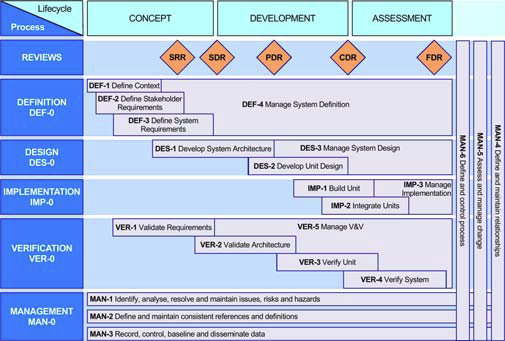
Process Tailored Environment

You use start pages and a phase hierarchy to build an environment tailored to your process. End users only need to be trained in your interface, reducing training time and costs:

  • Start pages are text and graphics controls that perform your choice of operations simply and easily
  • The phase hierarchy shows the process as a hierarchy in which an agile or phase activity, task, sprint, report or document is run by a mouse click. Different parts of the phase hierarchy can be shown to each user or stakeholder group.

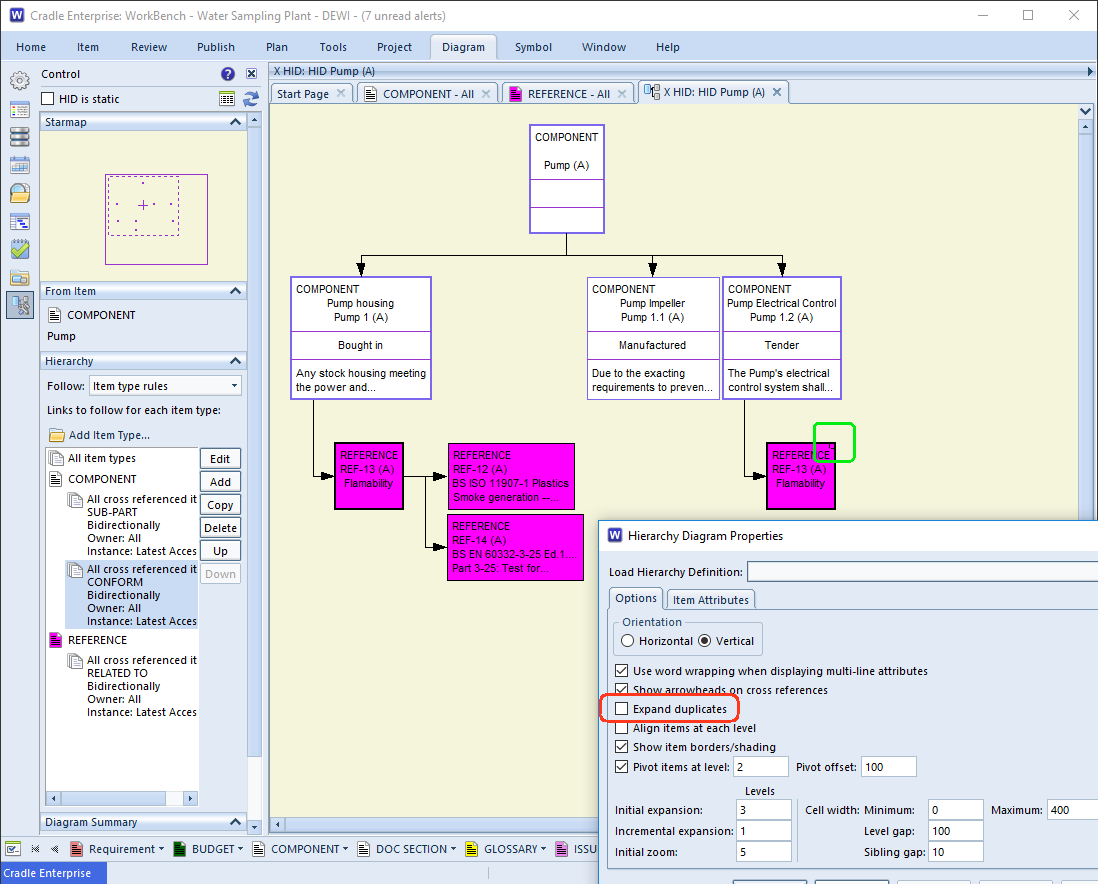
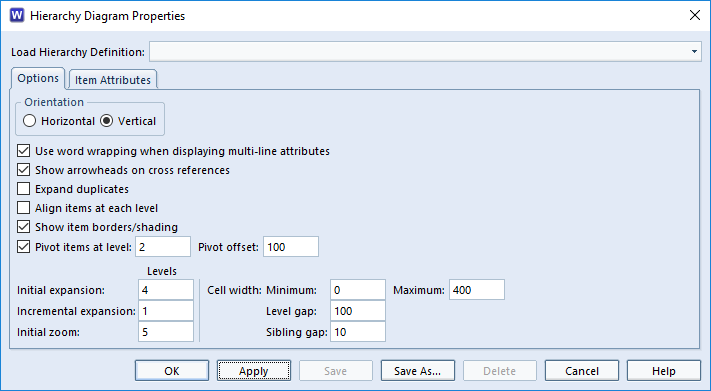
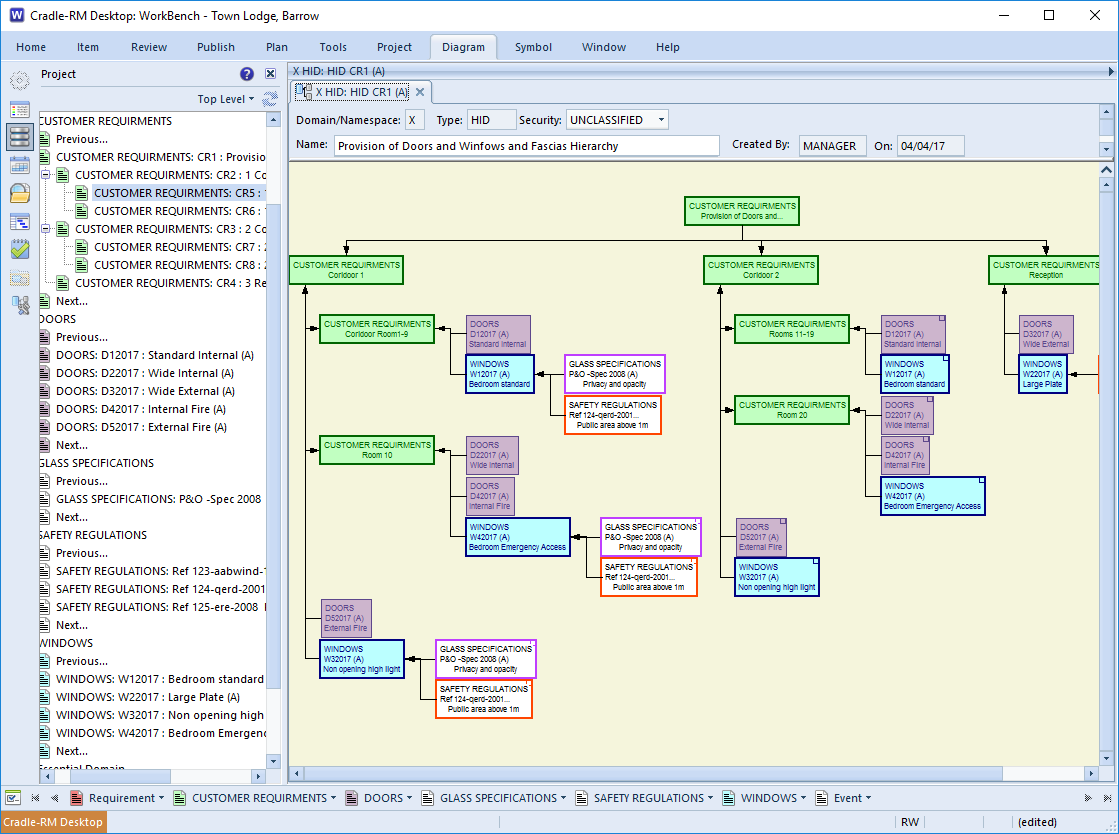
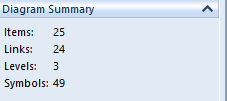
Traceability and coverage views are available as trees, nested and pivot tables, matrices and Hierarchy Diagrams. Unique transitive links give traceability across the full system lifecycle.

Configuration Management

Items evolve through versions that are managed in baselines and controlled by a built-in CM system, with mechanisms for review, baseline and version control, full change control, and audit trails.

Cradle can track all changes. Edits can be reversed selectively or by group. Items can be compared across edits and in baselines. Edits can raise alerts to users, and mark related items as suspect. All edits are permanently available, for change logs.

Adaptations

Cradle provides adaptations to allow variants of items. This mechanism is ideal for databases that contain a library of standard items and projects that use the library, and contribute to it.

Access Controls

Access controls apply to all items based on user roles, privileges, security clearances and skills. Users can be grouped in a hierarchy of teams, to create any access control scheme, such as for customers, subcontractors and IV&V. The creation and manipulation of links can be controlled, by item or user.

Cradle is multi-user. It locks information at item level, with automatic database commit after an edit. This maximises users’ interaction with the database and guarantees all data s up-to-date.

Alerts

Cradle’s alert mechanism sends messages by email (SMTP or IMAP), Cradle or both. Alerts can be selectively enabled and disabled. Alerts track events on items, including edit, review and formal change.

Discussions

The Cradle discussion mechanism allows even read-only users to add comments to items. Four other commenting mechanisms are provided.

Project Planning

Cradle can manage project plans and WBS. User task lists are maintained. WBS structures and progress data can be exchanged bidirectionally with external PM tools. Cradle can generate burn-down and earned-value graphs on any user-defined criterion to monitor progress.

API

Cradle is open and extensible. It provides multiple import/export formats, an API, a user-definable event-driven command interface, interfaces with other tools and bidirectional interfaces to Microsoft Office.

Query and Report Data

Cradle provides uniquely powerful data query and visualisation facilities. Each user’s environment can be tailored by defining custom queries, views, forms, navigations, matrices, reports and other facilities. All customisations have a scope, to be specific to the end user, or shared with other users of the same type (such as all customers or all managers), the user’s team, the entire project, or all projects.

Any desired compliance, coverage or traceability report can be created quickly/easily using Cradle’s queries, multi-row views/nested table view, and saved for later use.

Licensing

Cradle has floating, dynamic licensing and low cost read-only users. Open and named user licences are available. Everything described here is free of charge.

Licences, databases and schemas are interchangeable across Linux and Windows 8.1, 10, 11, Server 2012 R2, 2016 and 2019.

Optional support for Oracle and MySQL.
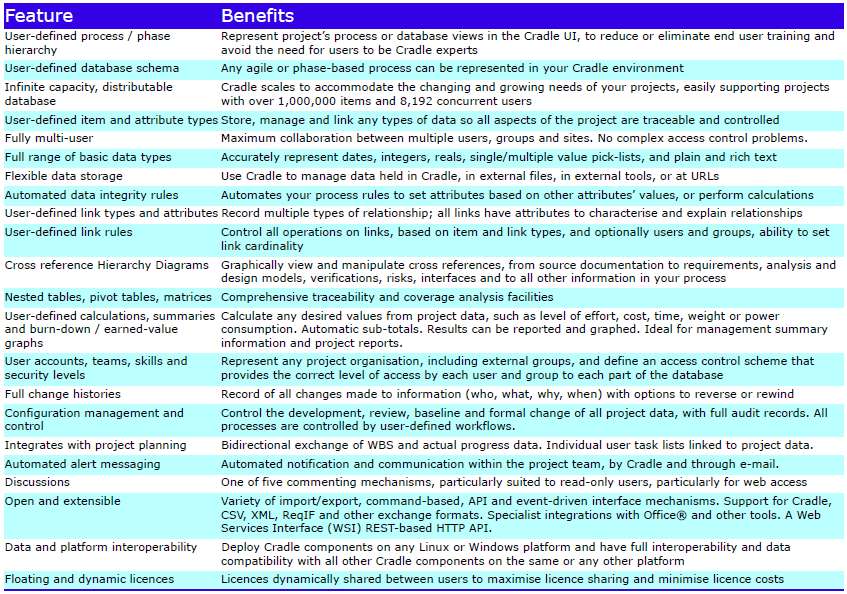
Feature Summary

Feature Summary - PDM
Feature Summary – PDM

Please contact 3SL for further information about Cradle PDM licences.

Can I control duplicates on my hierarchy diagram?

Duplicates In a Hierarchy?

In the case of a standard hierarchy in a book, it is unlikely you’d see duplicates. Chapter 1 may contain paragraph 1 and sub paragraph 1.1. (A complete reference of 1.1.1).  Paragraph 1 in chapter 2 would be 2.1 and therefore, even though paragraph 1 is a duplicate number the full identity is unique. However, in an engineering context, it is much more likely that information will be referenced in more than one place. Hierarchy duplicates are not unusual for referenced information. After all, it is much better to store the information once and use it many times. This is one of the major benefits of a Requirements Management tool. Imagine each component that has to meet a certain design standard. It makes complete sense to relate each part to the  standard, rather than copying the standard numerous times. In this regard the hierarchy contains duplicates. For each part that is drilled down many  components will end up with the same standard at a lower level of the hierarchy.

Linked Hierarchical Information

The following example shows the expansion of a component (Pump) into the sub components (we’ve followed a link type of SUB-PART). The diagram shows that two of the components have to comply with specific flammability requirements. Both Pump Housing and Pump Electrical Control are linked to REF-13 for Flammability. In turn this has lower elements of Smoke  generation for plastics and flammability of Cables.

The diagram illustrates that REF-1.3 is a duplicate by the small square in it’s NE corner.

How to control expansion of hierarchy duplicates on a HID
HID Expansions

Controlling Expansion of Hierarchy Duplicates

The Hierarchy Diagram Properties dialog has an option to control whether items seen as duplicates are expanded to further levels. Here the Expand Duplicates option is unticked which is why the user does not see REF-12 and REF-14 expanded below it.

Can I control the shape of a HID?

Hierarchy Diagram Output Control

Yes you can control the shape of a HID (Hierarchy Diagram). In the hid properties you can control the shape and data shown in your HID.

The cross reference links between each item control the connections shown on the HID.  The whole HID layout can be Vertical or Horizontal. The number of levels shown when first rendered (rather than dynamic click and expand) can be controlled. Whether an item is shown more than once if it has multiple cross references and general layout parameters. These are further detailed in How to Set Hierarchy Diagram Properties. Once you are happy with the layout it can be saved for use next time you need a similar pattern.

The HID properties dialog
HID Properties Dialog

Your data may produce a short wide tree or a long narrow tree. This can be difficult to see on the screen. This video shows how changing the pivot point, (the node at which the orientation changes from listing horizontally to vertically) can alter the overall display to be more usable.

Requirements Management for Windows and Doors?

Requirements Management Isn’t Just For The Big Players.

Your boss says “Don’t be ridiculous you don’t need, requirements management for windows and doors!”…

Your client has asked that the new Town-Lodge is fitted with UPVC doors, windows and fascias throughout. All fire regulations for a medium occupancy building must be adhered to. Locks must have master key and single key access. Glass must meet the company’s privacy specification.  And so on….. Whether you are building a spacecraft with millions of parts with hundreds of engineers, or you’re a firm of three fitters running a building service, you have requirements to manage. The HID (Hierarchy Diagram below) shows that a large number of interdependencies, even for the supply of simple items, quickly builds. Consequently the complexity of managing those requirements becomes more of a task. The requirements for windows and doors to a 20 room Town-Lodge involves glass specifications and safety constraints. These may differ depending on the location and size of the window/door. Planning, using a tool can simplify the traceability of any job.

HID showing how complex even a requirement for a few windows and doors can be complex
Even Windows and Doors Can Benefit from Requirements Management

Managing Change

The quotation has been accepted by the Town-Lodge. However, you were careful enough to note that the price was ‘subject to regulatory change’. When Ref 125-ere-2008 comes up for review and an amendment is raised, it is easy to trace what this impacts. Running a query on the Safety Regulations and showing the linked items, furthermore,  it can be seen these refer to the Emergency Access Windows. The trace shows these are linked to Customer Requirement CR6 and CR8. Finally it is a simple case of writing the email to the Town-Lodge and explaining regulatory change requires thicker glass and this will change the price for these two windows. Then await their approval. Therefore, in answer to your boss, “I can see the future for a tool to give us requirements management for windows and doors – can we buy a copy of Cradle ?”

Running a query to find the impact of a change, requirements management for windows and doors is necessary
Finding the Impact of a Change

Validation and Acceptance

The Lodge has agreed that they will pay when the work has been completed satisfactorily. Prior to starting work you have agreed a set of acceptance criteria. There could be endless tweaks or subjective “I don’t think that’s finished” conversations unless clear acceptance criteria and associated validation techniques have been agreed. Imagine you have a noise reduction requirement, “The noise reduction between the window open and window closed shall be 6dB”. Record the pre-agreed acceptance method as a Cradle item, and link this to each of the requirements with noise acceptance criteria. (This requirement in turn is linked to the rooms that it affects)

  • Noise Reduction Measurement. A white noise generator shall be sited at 1m from the window. The position will be adjusted until a measurement of 80db or more is detected inside the room with the window open at a distance of 1m inside the room. A second reading shall be taken with the window shut and this shall be subtracted from the first reading.

Running a query against the noise test will find all the rooms that this applies to. Now you can make your measurements and record your findings. You now have full traceability for each aspect of the product being delivered to The Lodge. “Dear Boss, Submit the invoice, Cradle aided demonstration to The Lodge site manager that all our acceptance criteria had been met. I think we’ve proved a use for requirements management for windows and doors.”

Make a Hierarchy Diagram (HID)

What is a Hierarchy Diagram (HID)?

A Hierarchy Diagram (HID) is a diagram style that is used to graphically show cross references between items. A HID is a tree that starts with the item of interest (source item) and shows the items that are linked to it by cross references. Each of these items’ cross references can be shown with their cross referenced items.

What’s linked to what?

Generate a HID (Hierarchy Diagram) in Cradle for a clear graphical representation of how your items interconnect. Simple to see what depends on what at many levels.


Hierarchy Diagram Options and Information

When a HID is opened, the Control sidebar is refreshed to show the following tabs:

  • Starmap – Is a highly zoomed view of the diagram.
Starmap
Starmap
  • From Item – Shows details of the from item.
From Item
From Item
  • Hierarchy – Ability to define a hierarchy and set the links to follow for each item type.
Hierarchy
Hierarchy
  • Diagram Summary Information – Shows the number of items, cross references, levels and symbols in the current HID.
Diagram Summary
Diagram Summary

If you would like more information on Hierarchy Diagrams and how you can use them, you may find this Cradle help article useful.

Article Updtaed29/01/2019 –  Added more information and examples

Show Link Types in HIDs with Colour

Looking for a way to brighten up your day?!

What better way than using Hierachy Diagrams (HIDs) that show link types in colour!

Hierarchy Diagrams (HIDs) are an excellent way to show the relationships between items in your database. The boxes in the diagrams are the items and their connecting lines are the cross references.

You can define a colour for each cross reference link type in the schema. If you do, then these colours are used to draw the cross references in HIDs.

This means that you can easily interpret the connections shown by the HID as, for example ‘has child’ or ‘is satisfied by’, or ‘allocated to’ relationships.

If you have not tried setting colours for your cross reference link types, please try it and see how this will transform the ease with which your HIDs can be interpreted!

Screenshot showing Example Hierarchy Diagram
Example Hierarchy Diagram

Force Directed Graphs

We are curious to know what people think of using force directed graphs as a way to display the relationships between items in Hierarchy Diagrams (HIDs).

At the moment, HIDs are drawn using a fixed algorithm, in which you can control:

  • The orientation (vertical or horizontal)
  • If the HID will pivot (change orientation) and if so, the level at which it pivots.

Force directed graphs are an alternative way to arrange the same boxes (items) and lines (cross references) in a HID.

What do you think?

ARTICLE UPDATED 13/09/2018 – CHANGED CATEGORY AND FIXED READABILTY