The Cradle DASH module provides the means to define Key Performance Indicators (KPIs) . It also provides the means to define their presentation as dashboards in web UIs, non-web UIs and reports.
Every project uses a process to create, review and publish its objectives, operational concept, sets of requirements, architecture and design models, and other systems engineering data. These processes will include:
Management reporting
Quality checks
Routine audits
of the volume of work completed, and the completeness and quality of this work.
Key Performance Indicators (KPIs)
KPIs are measures of the maturity of the information managed in the process, and therefore of the process itself.
Cradle supports KPIs as a convenient means to provide an overview of the status of an entire project, or any phase.
Any number of KPIs can be defined. Each KPI is a calculation based on one or more elements of one or more metrics:
Product
Sum
Difference
Deduction
Proportion
Percentage
combined to produce a single numerical value. The component values are derived from user-defined queries, that are searches of database items, or searches of the links between these items, or both. The component metrics can:
Count the values or calculate the total, mean, average, range or variance of the values from the items found by the queries
Use values held in attributes or the results from user-defined calculation attributes
These calculation attributes can use other attributes of the same item (this includes other calculations) and also attributes from linked items, such as calculating the total cost from the individual costs of a parent and its children.
Any number of colour-coded range bands can be defined for each KPI so that its value can be shown in a block with an appropriate background colour.
Using colours for the KPIs allows the overall project status to be seen at a glance. Typically, anything shown in green is good, anything shown in red will need urgent attention, and anything yellow needs to be monitored carefully. It is easy to apply such traffic light conventions in a KPI’s colour bands.
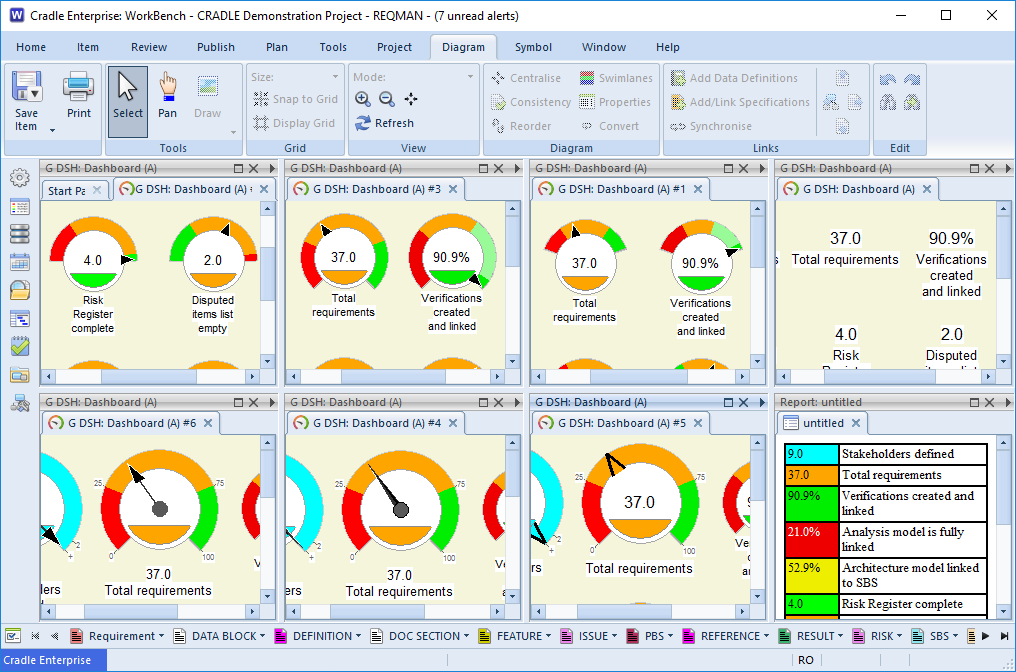
Dashboard in WorkBench
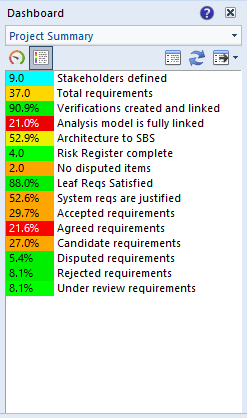
Dashboards
A collection of KPIs is held in a dashboard. Any number of dashboards can be defined, either personal to you, shared with other members of your team, or shared with everyone in the project, or available to all projects.
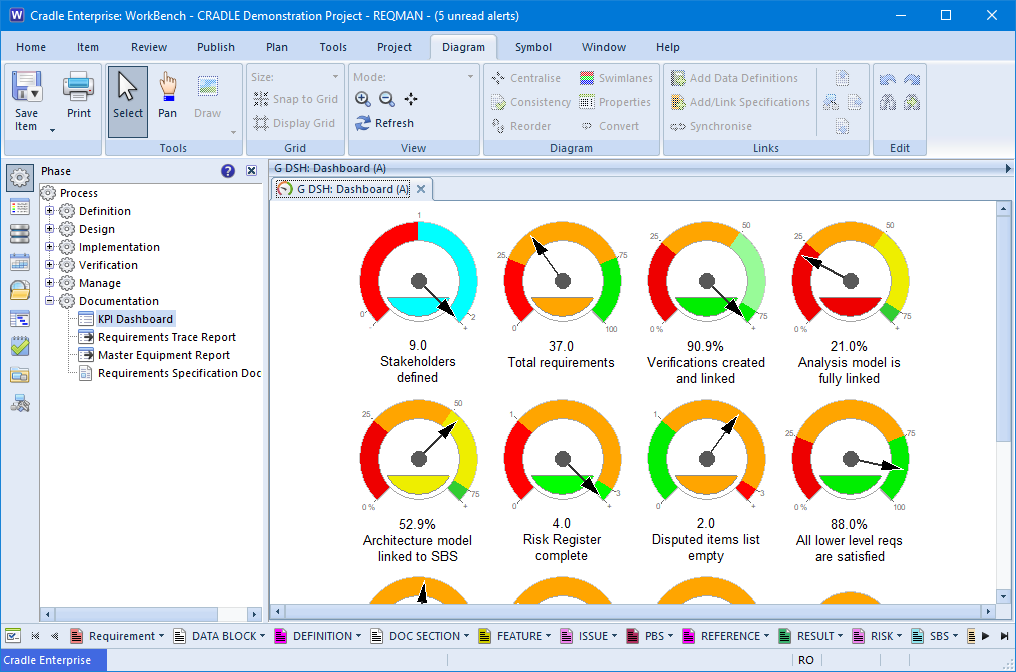
Each dashboard presents its KPIs as a column with the KPI shown either as a name and colour-coded number:
Dashboard in table view
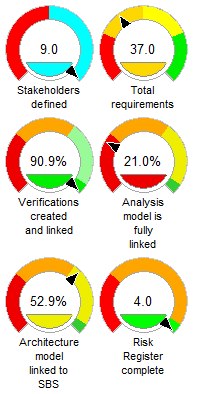
or as a dial:
Dashboard in dial view
The size and display styles of the dials can be controlled for each KPI.
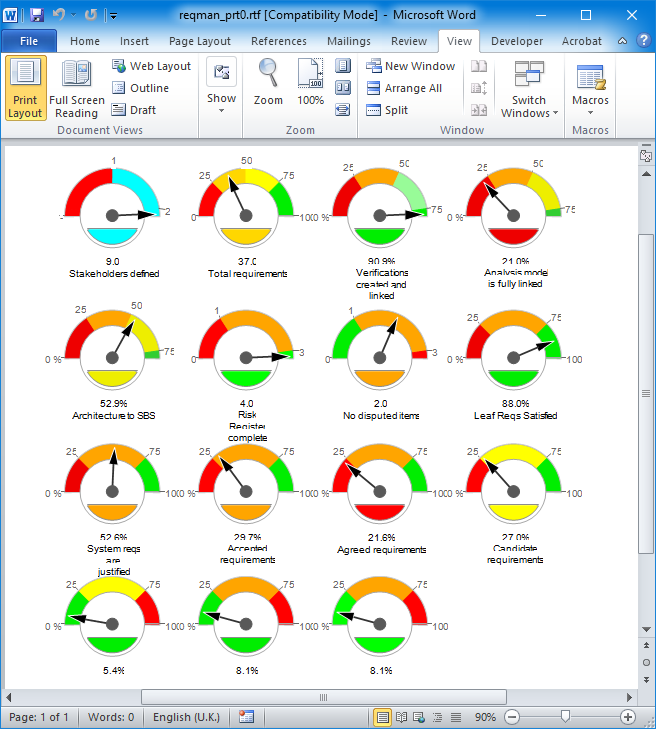
The dashboard can be published as a report, either as a table or as a set of dials. As for all reports, output can be to a file, a printer or the UI. Such dashboard reports are fully supported in web UIs, and non-web UIs.
Dashboard output to a report
The value shown in each KPI is a link. Selecting this value will display the list of items that have been used to create the KPI’s value.
Dashboards are shown in a separate sidebar in both web UIs and non-web UIs. One dashboard can be set as the default and can be shown automatically when the UI starts.
Dashboard showing dashboard sidebar
Custom web UIs could be created to show a collection of dashboards, for example to provide a simple overview of the project and more detailed analyses of the status of each work area.
Dashboards can be published to RTF, HTML and CSV files.
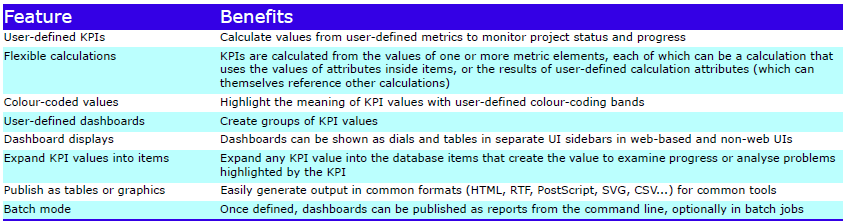
Feature Summary
Feature Summary – DASH
Please contact 3SL for further information about adding a Cradle DASH licence to your existing system.
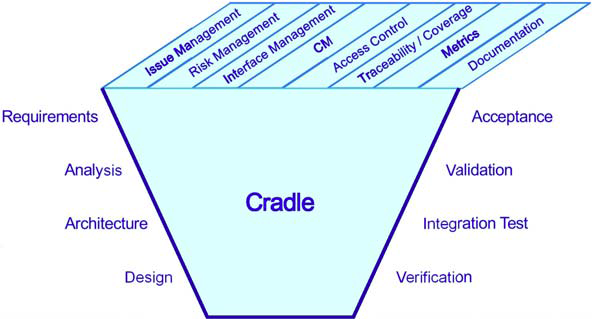
Cradle is an integrated requirements management and systems engineering environment with the features, flexibility and scalability for the full lifecycle of today’s complex agile and phase-based projects.
Overview of Cradle Modules
From concept to creation, from Cradle to grave.
Cradle is unique. It provides the tools and features to create and manage all your data, at all stages in your systems development, and at all levels. By managing all the data in one place, only Cradle can provide traceability across the entire lifecycle in one tool. Without Cradle, you have to assemble many products from many vendors, and you will still not have the full traceability that Cradle can provide.
What does Cradle Provide?
Cradle provides full requirements management, analysis, design, architecture and performance modelling, test, risk and interface management and metrics in one product. You can use all of these facilities, or combine Cradle with tools from other vendors. If you have such tools then Cradle will link to them, extending their scope from a part of the system lifecycle to all of it.
Cradle is multi-user, multi-project, distributed, open and extensible. It links to your existing desktop tools to create a tailored environment to suit your process.
Cradle provides built-in issue, risk and interface management. It supports comparative trade studies and analyses. Cradle provides a built-in configuration management and control system with baselines, version control, change histories and formal change control. It bidirectionally links a WBS and progress reporting to your project planning tool. With these capabilities, Cradle removes the need for you to try to connect risk, CM or change tracking tools to your systems engineering. Cradle provides everything you need, integrated and ready to use.
Access Control and Authentication
Cradle has customisable, hierarchical, access control facilities and integrates with your authentication, access control and security mechanisms including firewalls, LDAP and SSL. Cradle provides user-definable views of project data, tailored to each stakeholder group. With customisable navigation, review and entry tools and tailored web UIs, Cradle shows each user the data that they want to see, in the way that they want to see it.
Cradle Databases
Projects use user-defined, arbitrarily extensible databases, linked to external files, URL resources and data in external repositories. Each database is configuration controlled, with change histories, baselines, versions and variants, managed by configurable change requests and change tasks.
Cradle Access
Cradle supports off-line and remote access from geographically separate groups. Internet and VPN access is provided, with full support for project and company firewalls and DMZs.
It connects dispersed teams together, with tailorable discussions, alerts and e-mail.
Cradle Modules Overview
Cradle is modular, using floating licences to share resources dynamically across the project. The Cradle modules overview is:
Cradle-PDM provides a project infrastructure, from access control and user accounts, through a user-defined schema, phase hierarchy, team hierarchy and access controls to configuration management and open external interfaces.
Cradle-REQ provides requirements management from external source documents to baselined, engineered requirements linked to the rest of the system lifecycle. It allows you to define and manage user stories, validations, test cases, and any other types of information for all of your process.
Cradle-MET provides user-definable metrics to gather and analyse statistics from project data.
Cradle-SYS is a flexible analysis and design modelling environment. It allows any number of models to be built and grouped into model hierarchies in distinct analysis and design domains. Models are fully cross referenced to requirements and all other information. SysML is also supported.
Cradle-DASH provides user-definable Key Performance Indicators (KPIs) calculated from live project data in user-defined dashboards shown as tables or dials.
Cradle-PERF provides performance assessment, budget apportionment and data aggregation facilities for design models at any level in a system development.
Cradle-SWE provides code generation and reverse engineering for C, Ada and Pascal, to synchronise design and source code.
Cradle-DOC provides user-defined project document generation and a formal document register of project deliverables.
Cradle-WEBP provides web publishing of project data to static, hyperlinked, websites for external stakeholders.
Cradle-WEBA allows read-only and read-write access to project data through multiple, user-defined, web UIs that are tailored to each stakeholder group. It also provides external access to Cradle items through URLs.
Cradle-RISK provides ability to open and edit items of the mapped item type for risks. Also allows you to create and open risk profile graphs.
Cradle-TEST provides ability to execute test plans and create/edit test information, e.g. test cases, test results and test runs.
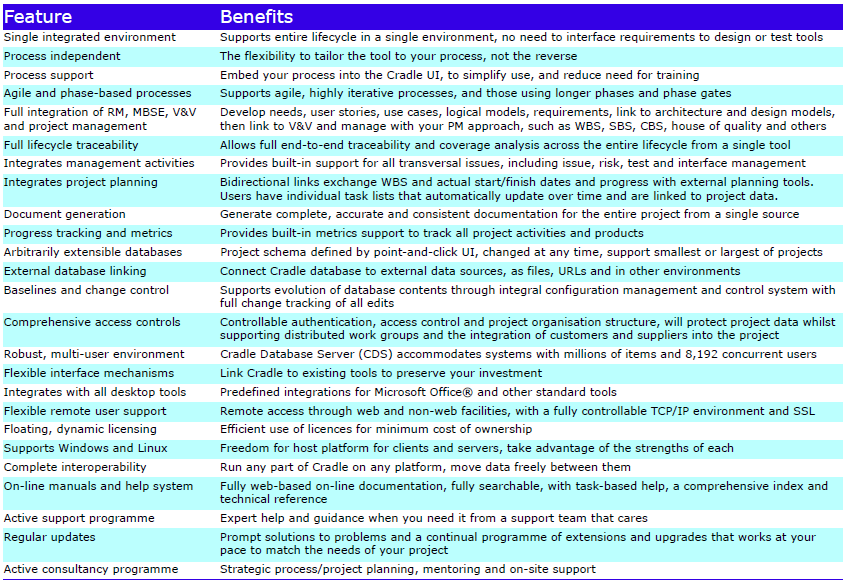
Feature Summary
Feature Summary – Overview
Please contact 3SL for further information about adding any of the Cradle modules to your existing system.
This newsletter contains a mixture of news and technical information about us, and our requirements management and systems engineering tool “Cradle”. We would especially like to welcome everyone who has purchased Cradle in the past month and those who are currently evaluating Cradle for their projects and processes.
We hope that 3SL and Cradle can deliver real and measurable benefits that help you to improve the information flow within, the quality and timeliness of, and the traceability, compliance and governance for, all of your current and future projects.
If you have any questions about your use of Cradle, please do not hesitate to contact 3SL Support.
PDUIDs
When we work with information, we need a way to distinguish each piece of information from all other pieces of information so we can be sure we have found what we were searching for. We do this by marking each piece of information in a unique way.
For information in databases, the markings are unique values called keys or identities. A piece of information can have multiple identities, each for a different purpose. For example, although a company’s payroll system is likely to identify each person by a unique Employee ID, each person’s details will also include their governmental tax ID (such as a National Insurance number, a Unique Taxpayer Reference, a Sozialversicherungsnummer or a Social Security Number). This tax ID will also be unique and so could also be used as an identity for that person’s information.
Cradle has two forms of identity, item identities and Project Database Unique IDs (PDUIDs).
We will publish a series of blog posts about PDUIDs, describing what they are, how to view them, how to use them, and how PDUIDs can be managed when you import information into your databases.
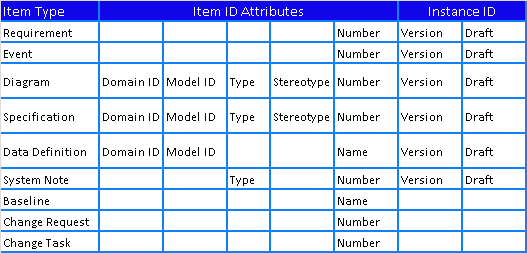
Item Identities
There are several basic item types in Cradle. Each basic item type uses a different combination of attributes to create a unique Item ID for items of that type:
An item is identified by this Item ID and a unique Instance ID, typically a version and draft.
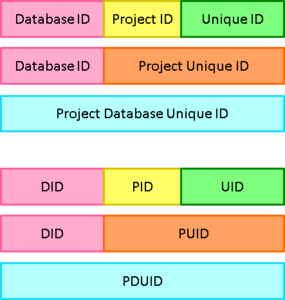
PDUID Structure
Project Database Unique IDs (PDUIDs) are a single, consistent, numbering system for all database information. Each PDUID is a 26 character string that contains a Database ID to identify a Cradle system, a Project ID to identify a project database and a Unique ID:
Structure of PDUIDs
A PDUID references all instances of an item. Therefore the combination of a PDUID and an Instance ID (a version and draft) will identify a specific item. So, this is an alternative to the Item ID and Instance ID and has the advantage of being consistent and a single numbering sequence for all types of item.
Further Details
For further details in this part 1 of a description of PDUIDs, please see the full blog entry here.
Remote Databases
A Cradle system can contain any number of databases. For the best performance, we recommend that databases are stored on disks connected to the machine that runs your Cradle Database Server (CDS). But, this may not be possible.
For example:
The local system may not have enough disk space available
The information in the database may be classified and must be stored separately
Here each database will be stored on a remote filesystem that must be referenced by a pathname so the CDS can work with it.
Further Details
For further details of remote databases, please see the full blog entry here.
Over Half Way Through the Year
It’s true; the 2nd July marked the halfway point of the calendar year. That went fast didn’t it?
It feels like we only just celebrated the New Year and now we are six months away from doing it all over again.
At this time of year, it is good to reflect on what’s already passed and what is to come this year. Here are some ways that might help if you are looking to refocus and recharge over the summer months.
Check in on Team Goals
How are the goals the team set at the beginning of the year going?
When was the last time your team reviewed them?
Now is a great time to reflect on any progress. Is your team on track? Is everybody on the same page?
Whatever the progress so far this year, there will be lessons to be learnt from it. It’s time to put an action plan in place for the remainder of the year. Now is a good time to get the team goals back on track:
Ask who do you need to help achieve those goals?
What’s the best way to communicate with them?
Is there an alternative way to achieve them?
Communication
Summer can be especially busy; school summer holidays, weekly events, fewer people in the office, and various demands can bring stress to everyone.
With all these additional activities going on, it’s easy for people to get distracted, lost and even burnt out.
Now is a great time to contact your team, employees and other connections. It can be as simple as a chat over a cup of coffee, a walk and talk or a business/working lunch. This will allow you to connect in a more casual way, which in turn, can help strengthen the link between you and your team.
Help your Team Avoid a Summer Decline
It’s no surprise that productivity can fall off a cliff when the sun comes out! Thoughts of ice cream, beer gardens and future holidays can lead our minds to wander off and our focus can end up in the bin.
Ice cream
Now is a good time to prepare your team and business to avoid any slump.
Congratulate your team on their efforts so far this year. One way to keep the momentum going is to set small achievable goals, something that can be done within a week to a month can help. As you complete and reach each one, the team will get a boost.
Having weekly/monthly meetings can allow the team to see those goals that have been achieved. Using metrics, dashboards and graphs can help your team see the progress made each week, month, year or more.
This progress will give reasons to celebrate and that can only be a good thing!
Remember: the team working together will make the dream work!
Feedback
We continue to receive positive feedback from our customers. We really appreciate ALL feedback, as this helps us to assess and improve both the products and services we provide.
In June, we provided a Cradle training course to one of our customers in Australia. They kindly sent the following feedback:
“Extremely informative classes. We are very appreciative of the customised content tailored for our envisaged use of the tool”
Independence Day (4th July)
4th July was a federal holiday in the United States commemorating the Declaration of Independence which was ratified by the Second Continental Congress on July 4th 1776, establishing the United States of America.
Social Media
We commemorated #DDay – 79 years ago. “We will remember them“:
DDay
Some of our customers, both old and new, attended various shows/exhibitions etc, e.g.:
@SercoGroup announced they have been awarded nine contracts to help the #IRIDE space programme. This programme is led by the Italian government and implemented by the European Space Agency. This is one of the most amibitous Earth Observation programmes in Europe.
With electric vehicles taking over the roads, our customer @Enphase talked about EV chargers.
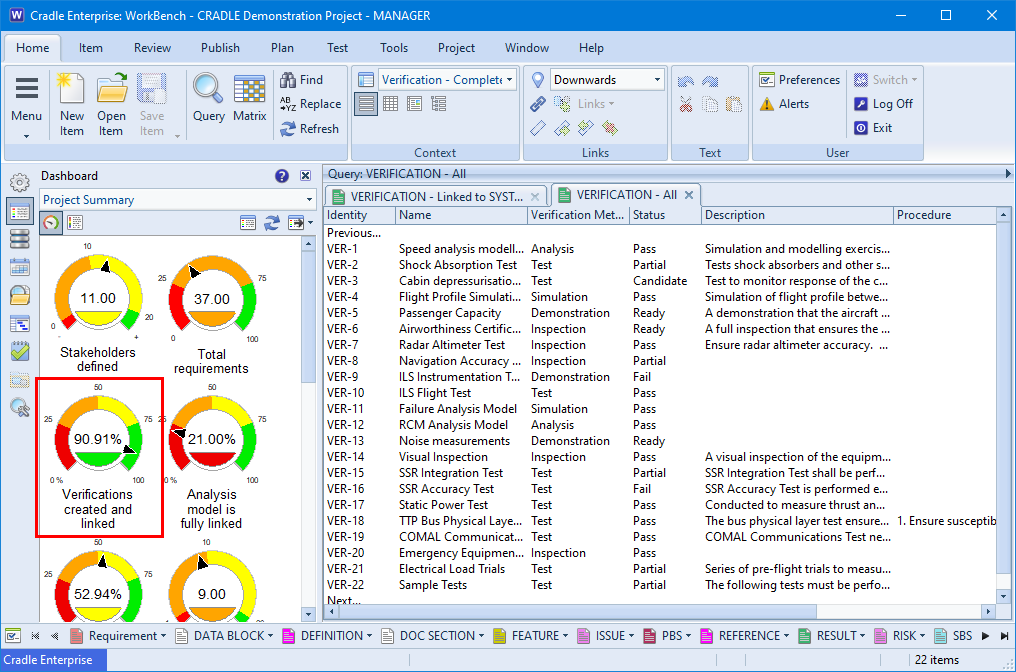
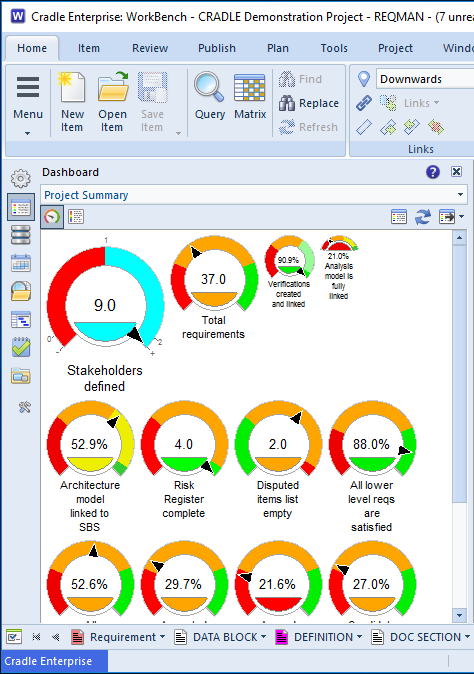
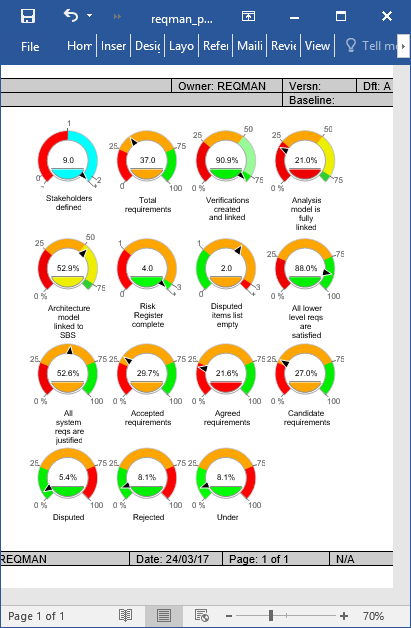
Cradle has supported KPIs being shown in the sidebar of WorkBench or Web Access for a number of years. This gives a quick overview of the health of the project. It’s giving a rating for each of the measurements and coloured highlighting to draw attention to those areas that need further input.
Traditional Dashboard
Due to its compactness, this table style allows many KPIs to be shown in a small space. However, one of the limitations with this approach is that the scale of the measurement and the relative position of the current value are not immediately obvious.
Bring on the Dials
A dial on the other-hand can display the full range, and the relative position. This allows a much faster assimilation of the data being shown to the user.
Dashboard Dial Sizes
New Cradle 7.2 Dashboard Dials Feature
Cradle’s dashboard dials are available in a number of sizes, thus allowing more important dials to be clearly seen. The size is set per dial as:
Large
Medium
Small
Minimal
There are also a number of styles available for the dashboard as a whole:
Round 270°
Round 180°
Round 140°
Text
These can be displayed with the following pointer types:
None
Triangle
Stick
Needle
Coloured
Dashboard Styles
It’s also possible to print these dials to the standard Cradle outputs: