In statistics, an error (or residual) is not a “mistake” but rather a difference between a computed, estimated, or measured value and the accepted true, specified, or theoretically correct value. In science and engineering in general, an error is defined as a difference between the desired and actual performance or behaviour of a system or object.
Some issues have been detected when running our Toolsuite applications (Document Loader or Document Publisher), e.g. when running dual monitors, with certain scaling settings etc.
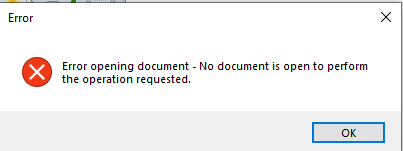
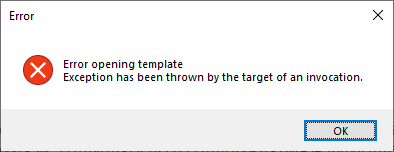
Example of Toolsuite Errors
Sometimes when having more than one monitor connected you may see one of the following error messages.
Solutions
The following solutions can fix the problem without having to remove the monitors.
Scaling
Set the scaling of both monitors to 100%
Restart your machine
Resolution
Set the resolution of both monitors to be the same
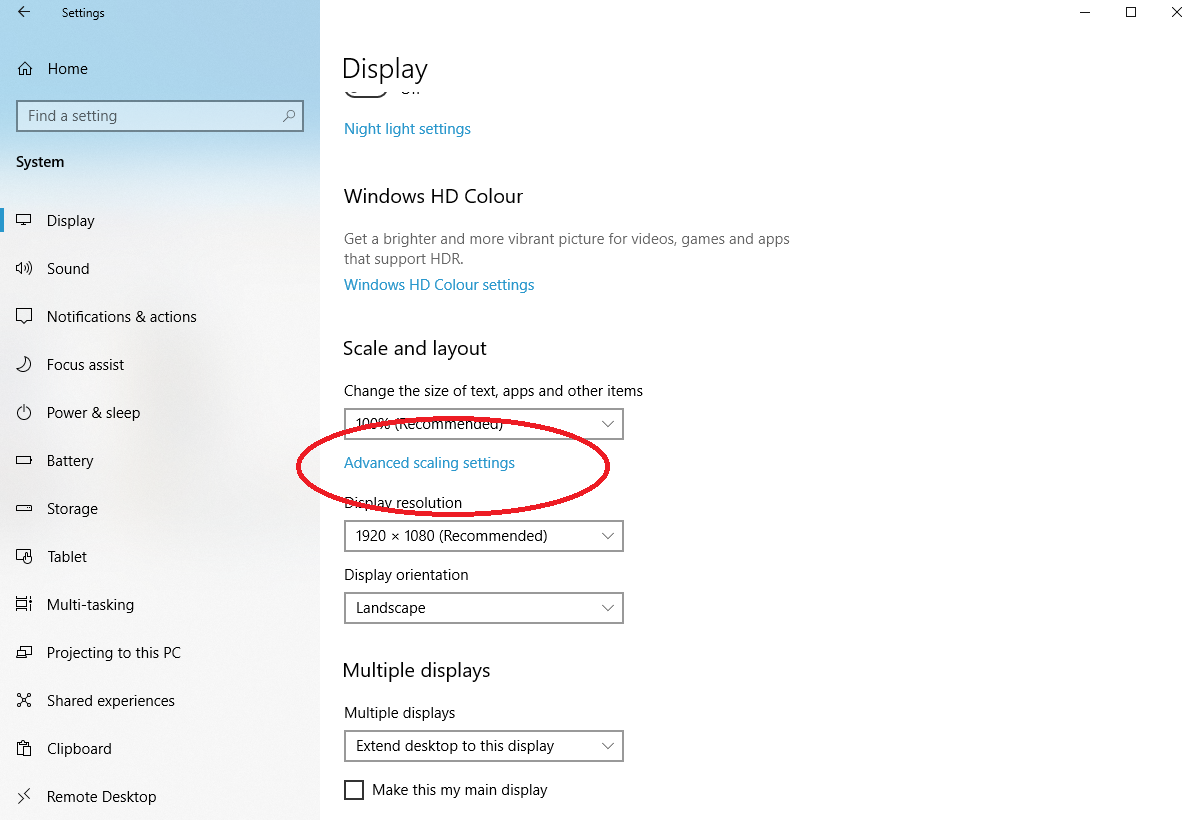
Advanced scaling
In Display settings click Advanced scaling settings
Enable Let Windows try to fix apps so they’re not blurry
Restart your machine
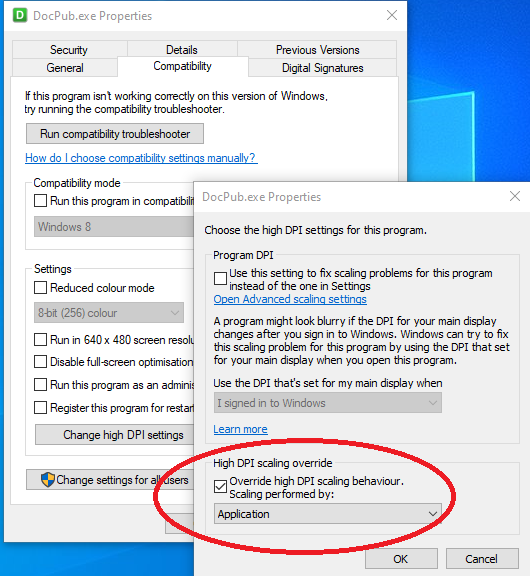
High DPI scaling override
Right click on DocPub.exe and choose Properties. Note: if your problem is with Document Loader then just follow the same steps but for DocLoader.exe
In the Compatibility tab select Change high DPI settings
Enable Override high DPI scaling behaviour
Restart your machine
Program DPI
If the above doesn’t work then in the same dialog as High DPI scaling override enable the Use this setting to fix scaling problems…. within the Program DPI section
Optimise for Compatibility
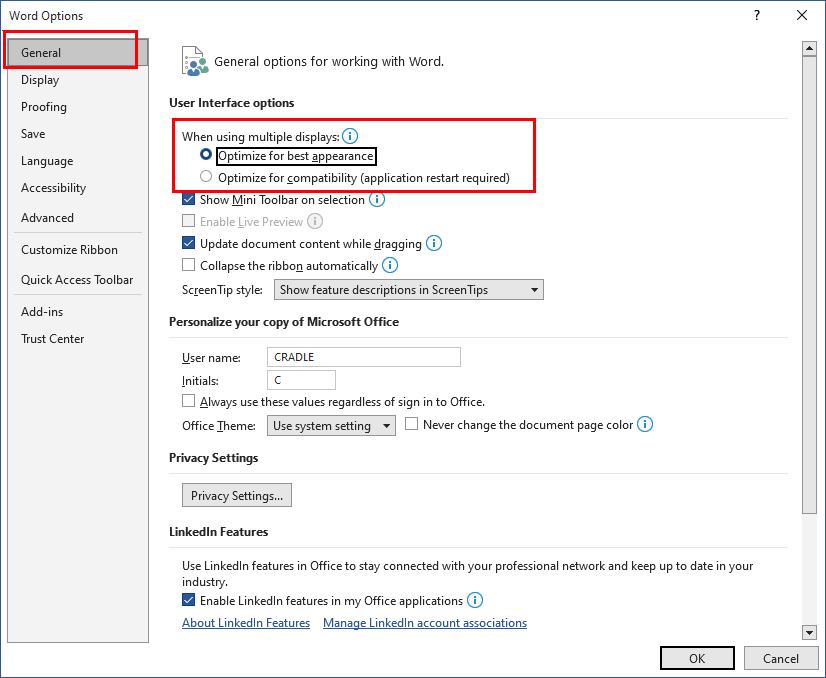
Open Word Options
Select the General tab
In User Interface options ensure the When using multiple displays option is set to Optimize for best appearance
Word Options
Restart your machine
Test Document Publisher/Document Loader and IF you are still getting the error after following all of the above steps then change the option to be Optimise for compatibility and then restart your machine.
Environment Variable or Command-line Switch Stack-tracing
As with many complex products Cradle monitors its internal operation and on the rare occasion that something goes wrong it writes information to a log. CRADLE_ERRORSTACK controls how much information is logged internally and output on these occasions.
If in the unfortunate case a Cradle tool crashes, there will often be a log produced in the %CRADLEHOME%\logs\errors directory. This will enable 3SLSupport to diagnose simple cases such as a lack of memory on the machine. If the case is more complex, the development team may need to know at which point the program was processing at the time the error occurred. CRADLE_ERRORSTACK will enable additional internal logging that will output a simple execution stack trace into the log. This can aid diagnosis and resolution.
Switching Stack Trace On and Off
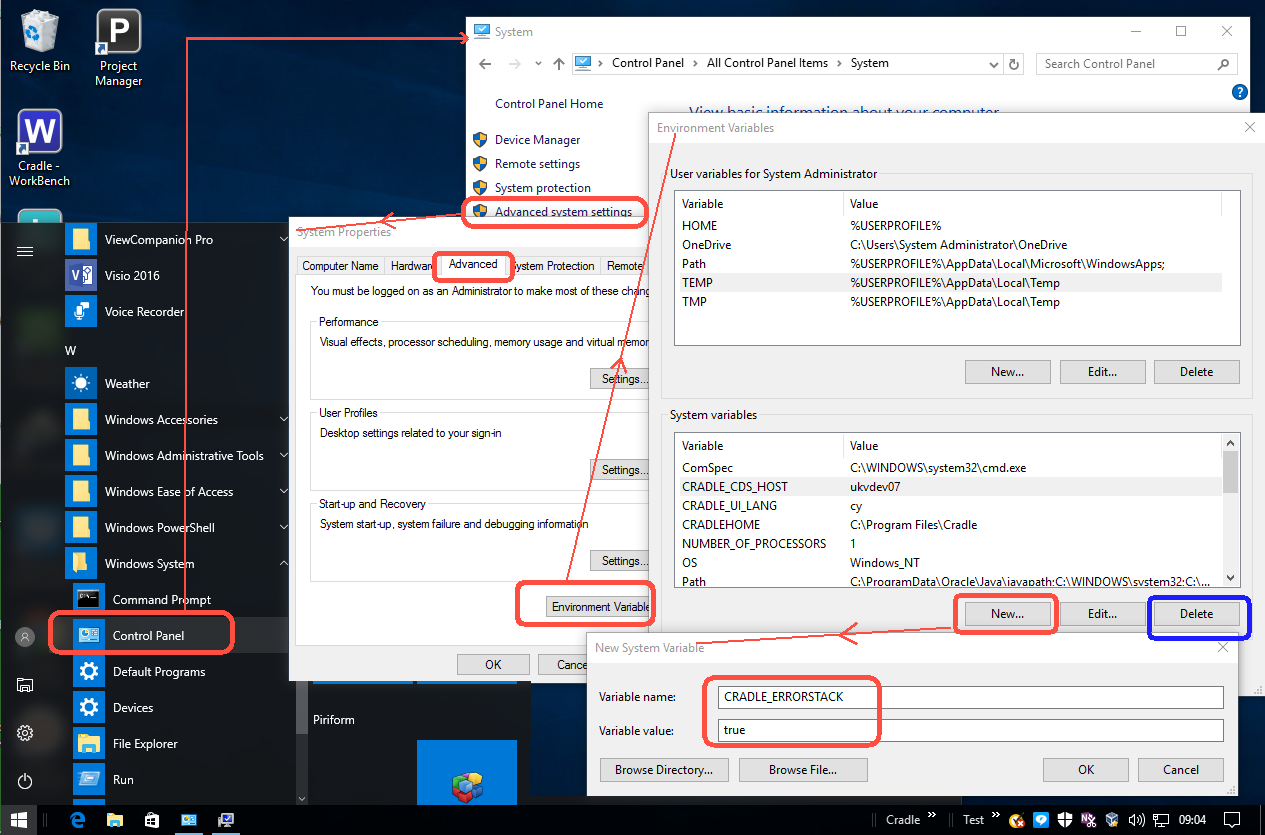
CRADLE_ERRORSTACK is an environment variable. You can set it via the control panel’s Advanced system settings (see the screenshot).
In Linux if you are editing the environment config files bashrc, profile, etc for either the system /etc/profile or the user ~/.bashrc then use:
export CRADLE_ERRORSTACK=true
Or as we now set CRADLEHOME in /etc/profile.d/cradle.sh you can put the ‘CRADLE_ERRORSTACK=true’ variable in this file.
Or you could start the Cradle tool from within a command shell, (On Windows®) press windows key type cmd and then in the shell set CRADLE_ERRORSTACK=true, then launch the tool e.g. "%CRADLEHOME%\bin\exe\windows\work.exe". You can also set a -errorstack parameter to your command line option, i.e. work.exe -errorstack to start WorkBench with the stack on.
Environment Variables
Should I leave CRADLE_ERRORSTACK on?
Generally there is no need to leave the stack trace on all the the time. There is a small performance hit if you do, so unless you are having problems we don’t advise you leave it enabled.
What if that still does not sort the issue?
3SL Support may ask you to turn on tracing which produces a complete execution trail from the product. This has a large overhead and uses disk space and is only in used in the very trickiest of issues. Rest assured, it’s unlikely you’ll have to use it, but if you do there is a post here that explains tracing.
If, during an install, you receive the error ‘api-ms-win-crt-runtime-l1-1-0.dll is missing’ this is due to Microsoft® Windows updates not being applied. To fix this you need to:
Install Windows updates by:
Go to Start > Control Panel > Windows Updates
Check for updates
Install all available updates
After the updates are installed, restart your computer
After the restart repeat the steps above again until no more updates are available
Once ALL Windows updates have been installed, download the Visual V++ Re-distributable
For Windows 64-bit: Visual C++ Re-distributable for Visual Studio 2015 (64-bit)
For Windows 32-bit: Visual C++ Re-distributable for Visual Studio 2015 (32-bit)
Run the vcredist_x64.exe (64-bit) or vcredist_x86.exe (32-bit) and select Uninstall
In the rare occasion that something has gone terribly wrong with you database, here are some things that you may find helpful:
Retrieving Licence Statistics
If you are finding that you are running out of licenses or you just want to have an overview of license usage over a period of time you can use c_usage which can be run to output the information from Cradle into an excel file. You then copy this date from the excel file into a spreadsheet we supply called c_usage.xls which once the data has been pasted into the spreadsheet will then update it’s other worksheets which will display the corresponding information in graphs.
All components of the Cradle software distribution include crash resistance such that, in the event of an internal error occurring within the software component, internal recovery action is taken, and the software component remains running.
In all cases, the recovery action includes adding an entry to an error log file that provides a complete description of the internal environment of the software component when the problem arose.
This log could potentially become quite large over time and you may only want retrieve one or more entries from this log, c_errlog can be used to retrieve one or more entries from the error log files produced by Cradle.
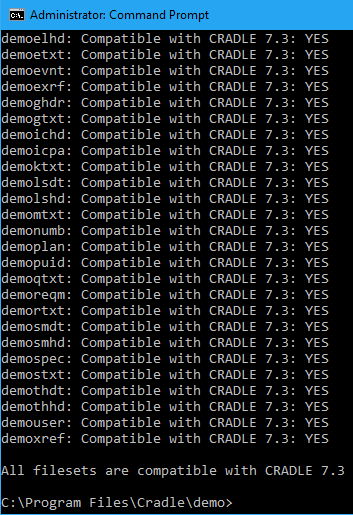
Check the version of your database files The c_pdbver utility allows you to determine the version of your database files, it check the filesets are compatible with a version number you specify and confirms whether or not each fileset is in the specified version.
If you have had a machine crash or hardware failure when Cradle was writing to the database files you may want to check and repair the database file to ensure you don’t see any further corruption to your database. We supply a utility for this called dcheck that checks and repairs damage to the ISAM files within a Cradle PDB.
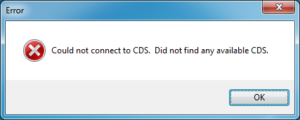
If you receive a CDS connection error when starting a Cradle tool, the following steps will help you diagnose the most common CDS connection errors and show you how to resolve them. These errors are highlighting a communication problem between the client tool (e.g. WorkBench, Document Loader or Document Publisher) and the Cradle Database Server (CDS). There are four main possible causes ;
Can not connect to CDS error dialog
1 – The CDS is not running.
The CDS is on the same machine as the client, (e.g. Single user products or Cytrix installations) . Run Project Manager to see if the CDS is running or look in the process list (Task Manager on Windows, or ps Process List on Linux) for crsvr.exe.
The CDS is running on another machine
In the same TCP/IP subnet (e.g. usual client/server Enterprise installation) . Start Project Manager and look for the CDS.
Another subnet. Login to that machine and look for it in the process list or contact the administrator of that other machine.
Solution – Start the CDS on the machine where it is to run, by starting Project Manager and starting the CDS. Or at a Linux command prompt
c_start start
If the CDS will not start and is not returning any messages then open a command prompt and perform the following dependant on platform
Windows
Type the following in a command prompt
cd %CRADLEHOME%\bin\exe\windows
crsvr.exe
Linux
Type the following in a command prompt on Linux 32 bit;
cd $CRADLEHOME/bin/exe/linux-ia32/
./crsvr
Type the following in a command prompt on Linux 64 bit;
cd $CRADLEHOME/bin/exe/linux-x86_64/
./crsvr
2 – CDS is running but the Cradle tool is not communicating with it.
Check the CDS is running on a different PC but your Cradle system is set to standalone.
Look for an environment variable called CRADLE_STANDALONE and if it exists either delete it or set its value to false.
Then look in the startup file for the variable STANDALONE and ensure that it is set to false.
3 – The Cradle tool is trying to communicate with the CDS, but its communications do not reach the CDS.
Check that there is evidence that the Cradle tool’s messages are reaching the CDS. To do this, look at the file cds_access.log on the machine running the CDS. There is one multi-line entry in this file for every connection attempt that the CDS receives. If the Cradle tool’s attempt to connect to the CDS reaches the CDS, it will be in this file. Make a note of the last entry in the file, then close it and attempt to start the Cradle tool. Look at the cds_access.log file again and see if a new entry has appeared at the bottom of it. If not, then the Cradle client’s attempts to connect to the CDS are not being received by the CDS.
If the CDS runs on a machine in another TCP/IP subnet to the PC where the tool is being run, define an environment variable called CRADLE_CDS_HOST whose value is the TCP/IP address or hostname of the machine running the CDS. Run the tool again and look for an entry appearing at the bottom of the cds_access.log file. If the CDS runs on a machine in the same TCP/IP subnet to the PC where the tool is being run, look for the CRADLE_CDS_HOST environment variable and check that its contents are correct. You can delete the variable if this CDS is the only CDS running in the subnet.
Ensure the correct ports are opened on your firewall, the specific ports can be edited from the ports file.
4 – The Cradle tool can communicate with the CDS, but the CDS is ignoring it.
On the machine running the CDS check the cds_hosts file. This file has to either be empty ( all clients are allowed to be connected to the CDS) or it contains a list of IP address / machine names allowed/disallowed to connect to the CDS.