
Switch on tracing?
Support have asked me to switch on tracing, what is it, and how do I do it?
Occasionally some customer installations don’t allow Cradle to function as required. In order to get to the bottom of this the Cradle Support Team may ask you to ‘turn on tracing’. This will give a comprehensive report of what’s happening internally in Cradle. You can then send these logs for diagnosis. This will then help us resolve your installation issue as fast and efficiently as we can.
The files
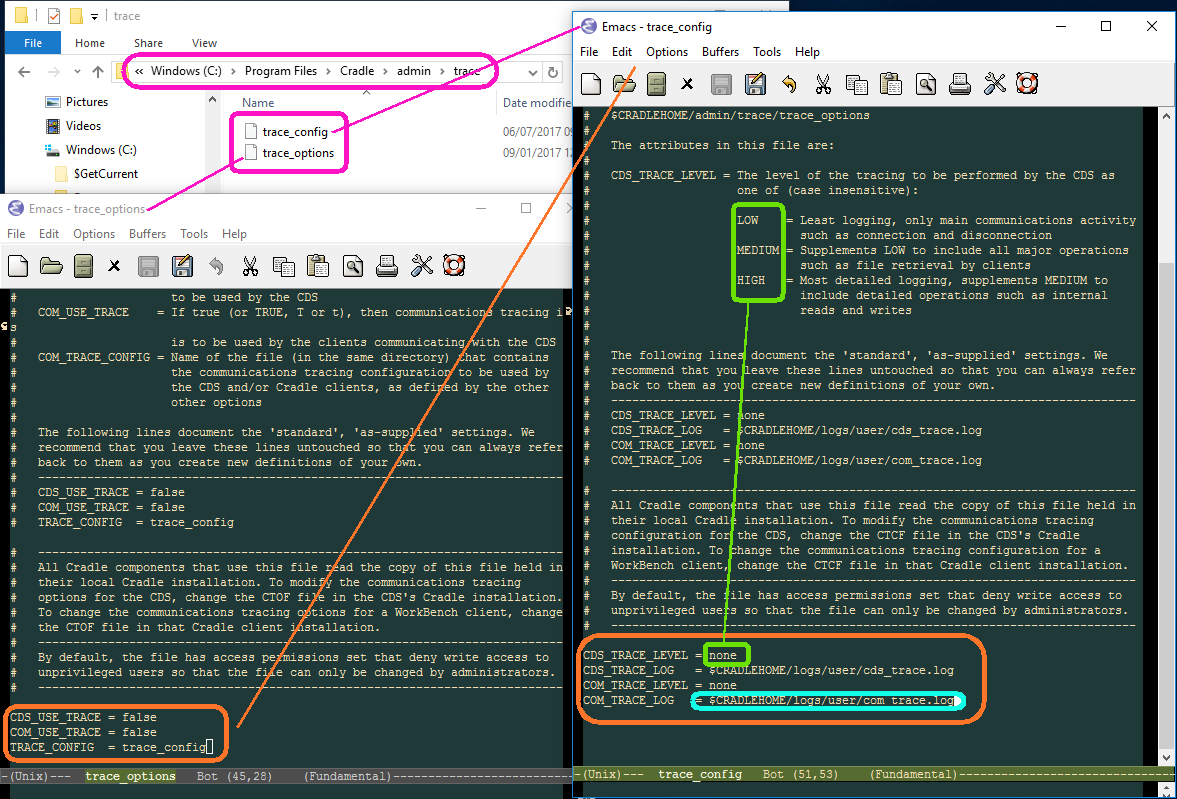
The files trace_options and trace_config control how tracing is performed. By default they are located in %CRADLEHOME%\admin\trace
trace_options
This file controls when to collect, and is used to simply switch tracing on or off. Setting CDS_USE_TRACE to true will set CDS (Cradle Database Server) tracing on. The file must be the one located on the machine running the CDS. Setting COM_USE_TRACE to true will set tracing on for any client communications. The file that you alter must be on the client machine in question.
The TRACE_CONFIG option allows you to choose which file you want to use to control the tracing, most of the time we suggest you leave it as trace_config in the same directory.
trace_config
This file controls what to collect and where to send the output. The CDS_TRACE_LEVEL and COM_TRACE_LEVEL both control how much tracing to do from LOW, through MEDIUM to HIGH. This will give basic ‘someone logged on’ reports at LOW through to ‘this message was sent from this process to that client’ at HIGH. Support will advise which level to use, but be wary of leaving HIGH switched on for too long as it will create very large reports.
The CDS_TRACE_LOG and COM_TRACE_LOG are the location where we will write the file. The default logs folder is usually best.
When you have finished tracing don’t forget to set the values in trace_options back to false.