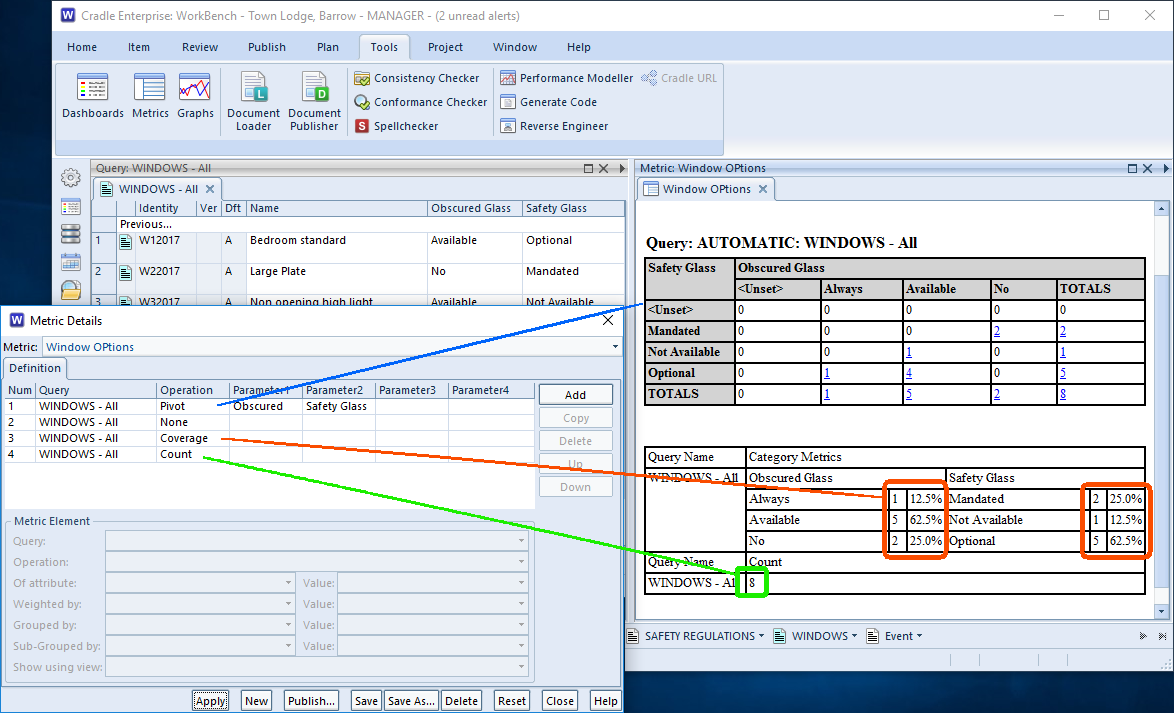
What percentage of our windows are mandated to use safety glass?
With a change in the overall cost for safety glass this may be one of the questions asked at the board level. You may now be tasked to provide some quick data analysis. Cradle provides a metrics module which can provide a range of data analysis options.
In this case, applying the coverage metric to the windows in the database, it can be seen that 25% of the windows in the range mandate safety glass. A further 62.5% have it as an option. Therefore, from a costing point of view, the firm must revisit the pricing of a quarter of their range. Additional work will be needed for those customer or location based offerings.

Why windows? We produce biological markers for flu viruses!
For illustration, hopefully this is a simple topic understandable by all. It is an example of quick data analysis. With such a diverse range of customers and industries, it would not be possible to pick a universal example. Metrics that find mean or highest values would not make sense for the above pick-list values, but would be really useful for analysing test results. Read on to discover the full range of metric options in Cradle’s data analysis.

