A Holistic View – The Context Diagram

Context Diagram – the world around our project

A context diagram aids visualisation of where a project sits in relation to its external interactions. We don’t want to model those external systems, but we do want to know how they interact with our system.

Automatic wipers for a car don’t need to know how the weather works, but they do need to sense the presence of water on the windscreen. The context would, therefore, include the weather as an external influence with ‘rain’ or ‘rain present’ being signalled to our system. If our company only produces the wiper element the actual car is outside our scope. However, this is where we get our power from and it’s where we will install them so the car is part of our context. The interactions with the car such as ’12v supply’ and ‘user control signal’ are likely to show a part of the holistic context.

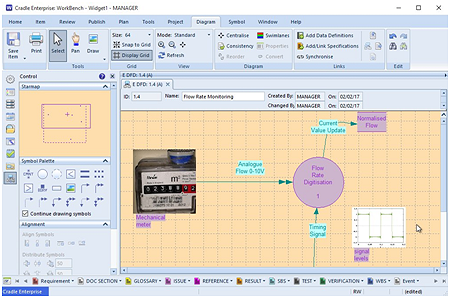
Data Flow Diagram (DFD)

In terms of functional analysis and design the DFD shows the external elements with which our main system interacts on the context diagram. This usually has only one process on it, and that is our system of interest.

an example context diagram
Context Diagram – DFD

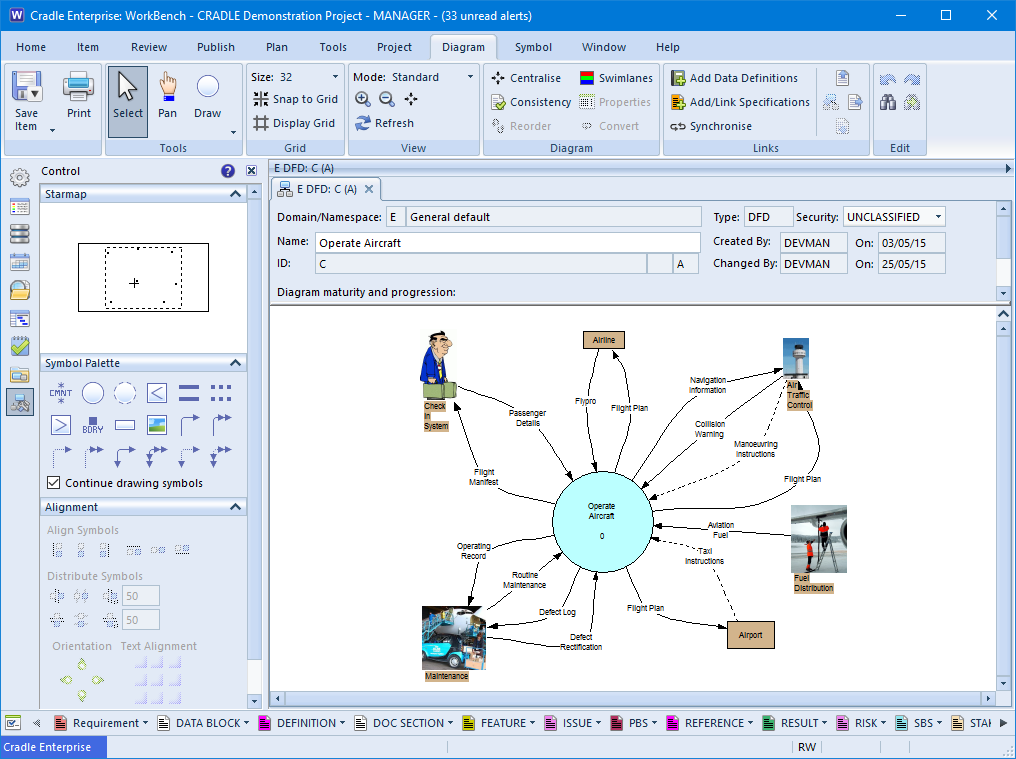
Taken from the Cradle demonstration project this diagram shows our system of interest is operating the aircraft. The externals that we interact with form the context within which the project operates. This includes the booking system, the fuel suppliers, the control tower and so on.

When the design and analysis are broken down at lower levels, the passenger details or navigation information will have to be handled by parts of the target system. If there is anything that does not balance at the lower levels, then a function must be missing. It implies that we have an input stimulus or an expected output and have nothing to handle or provide it.

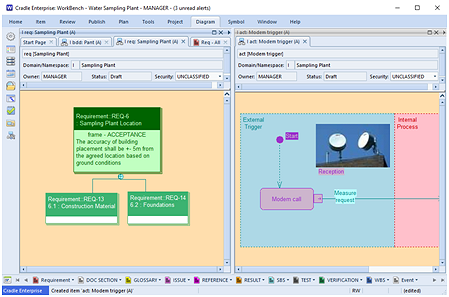
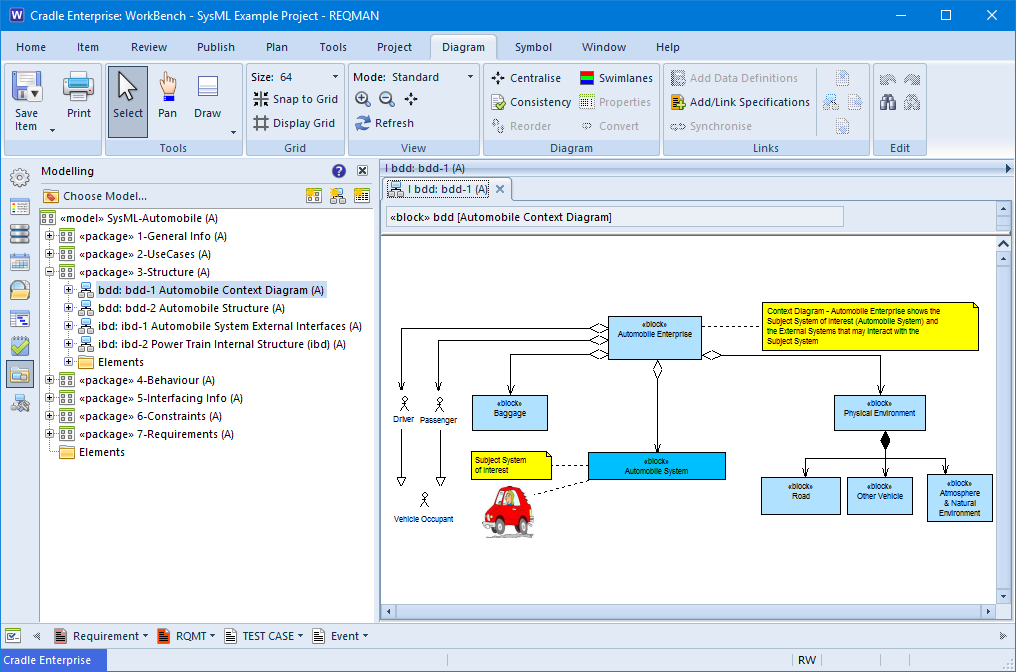
Block Definition Diagram (bdd)

Context diagram notations are not restricted to Yourdon, a SysML bdd is also used to describe the context. Information gathered from the use cases and operational scenarios can be used to build a holistic view.
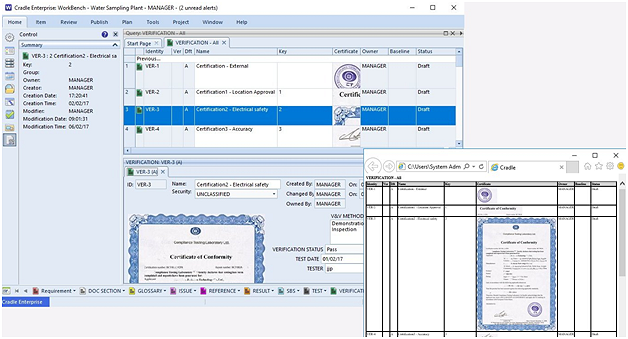
Context diagram shown on a bdd
Context Diagram – bdd

Visual

Whilst not necessary, adding images to your context can aid communication to your stakeholders and customers. They don’t really have to understand the notation to visualise the ‘Passenger’ as a person interacting with the flight. In Cradle, images can be added to the diagram as standalone images, or can actually replace the symbol on the diagram. (The image in the latter will follow all the rules and have the underlying specification of the real diagram element).

A Picture Is Worth A Thousand Words

A Picture…

A proverb, a newspaper editor’s comment on journalism, a printer’s marketing spiel, the origin as discussed in Wikipedia and throughout the web is a little muddied. However, we think you’ll agree that a picture can convey very quickly what you would need many paragraphs to say.

There are many uses of images and pictures in capture, design and development. From the customer’s point of view this may be the easiest way to communicate what they want, even if they don’t know the language of the supplier. The designer drawing a picture of how the system operates is creating a model that communicates more than the specifications of each part. Images of anything from an oscilloscope trace to a microscope slide may be used as evidence of meeting a requirement. Photos of the final implementation can be a fabulous selling point.

Pictures in Cradle

Cradle Workbench
Cradle Workbench

Each of these elements can be captured in Cradle throughout the lifecycle of a product.
Here a requirement, capturing a photo of the location for the installation, provides the user with the textual description (Latitude and Longitude) and a clear visualisation of the site.

The model itself, and pictorial annotations within, can illustrate the design. The design model itself is supported through numerous notations including (to name but a few):

  • Holistically viewed with SysML (Systems Modelling Language) notations.

    SysML Disgrams
    SysML Disgrams
  • Behaviourally described along a timeline with eFFBD (Extended Functional Flow Block Diagram)
  • Described in OO (Object-Oriented) methods with Use Case Diagrams describing how the system sits in its environment with CPDs (Component Diagrams) describing the parts
  • Functionally modelled through Yourdon DFDs (Data Flow Diagrams) and STDs (State Transition Diagrams) etc.

    Pictures inserted in a Data Flow Diagram
    Pictures inserted in a Data Flow Diagram

A copy of a test certificate can be stored in a compliance item type, linked back through the design to the requirement. These could then be printed as an HTML report or more formally as figures within a Document Publisher output.

Images included in View, Form and Printed output

From concept to creation, you, Cradle and 3SL!